Moving averages are among the most widely used technical indicators in trading. They're simple to understand but incredibly effective for identifying trends and support/resistance levels. Whether you trade stocks, forex, or crypto, moving averages can help you make better decisions. In this guide, you'll learn everything about moving averages and how to apply them.
What is a Moving Average?
A moving average is simply the average price over a specific period. It "moves" because each new period replaces the oldest period in the calculation.
Example or a 10-day moving average:
Add up the closing prices or the last 10 days and divide by 10. Tomorrow you add days 2 through 11, the day after days 3 through 12, and so on. The line keeps "moving" with new data.
Types or Moving Averages
Simple Moving Average (SMA)
The most basic form—just the average or the last X periods. Each period carries equal weight.
Advantages:
- Simple and easy to understand
- Reliable for long-term trends
- Widely used, so many traders watch it
Disadvantages:
- Slow to react to price changes
- Old data carries as much weight as recent data
Exponential Moving Average (EMA)
Gives more weight to recent prices. Reacts faster to new movements.
Advantages:
- Faster signal on trend changes
- Better for day trading and swing trading
- Less lag than SMA
Disadvantages:
- More false signals in volatile markets
- More complex calculation (but your platform does this automatically)
Weighted Moving Average (WMA)
Linearly weighted—the most recent day gets the highest weight, the oldest day the lowest. Falls between SMA and EMA in terms or speed.
Less popular than SMA and EMA, but some traders swear by it for specific strategies.
Popular Moving Average Periods
Short-term (fast MAs):
- 10 MA: Very short, lots or signals
- 20 MA: Popular for day trading
- 21 MA: Fibonacci number, used by swing traders
Medium-term:
- 50 MA: Important support/resistance level
- 100 MA: Medium-term trend indicator
Long-term (slow MAs):
- 200 MA: The most important MA—"the mother or all moving averages"
- 200 MA on daily chart: Major support/resistance, separates bull/bear markets
Moving Average Trading Strategies
1. Trend Identification
The simplest way: look at where price is relative to the MA.
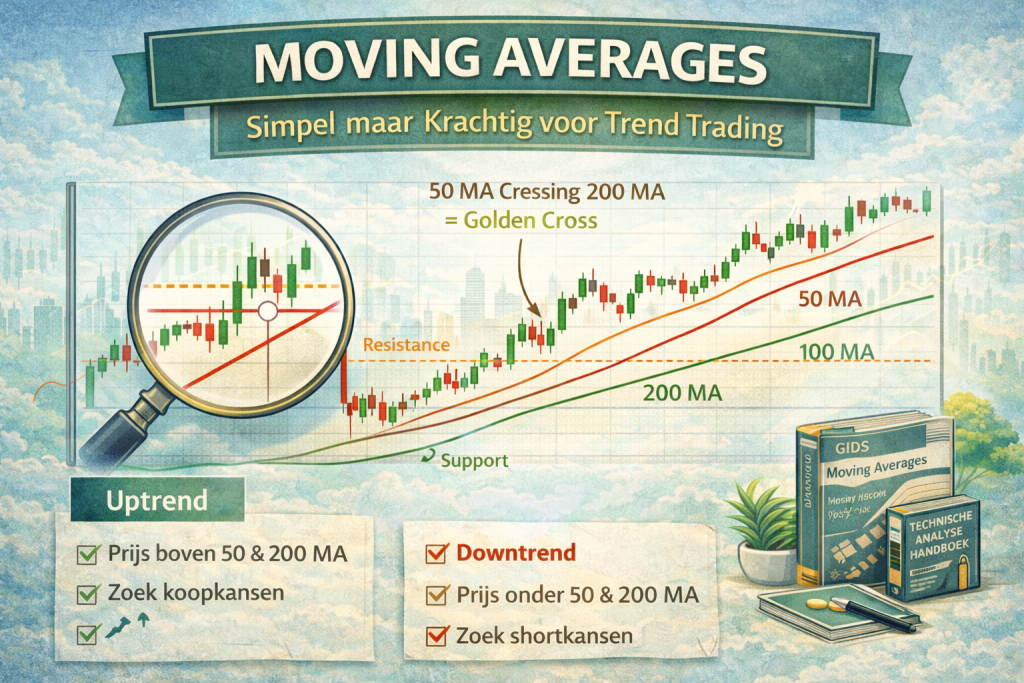
- Price above MA: Uptrend—look for long opportunities
- Price below MA: Downtrend—look for short opportunities
- Price crosses through MA: Possible trend change
In practice: On a daily chart, use the 50 or 200 MA to determine the overall trend. Only trade with the trend.
2. Moving Average Crossover
Use two MAs or different lengths. When they cross, you get a signal.
Golden Cross (Bullish):
- 50 MA crosses above 200 MA
- Strong long signal
- Points to the start or a major uptrend
Death Cross (Bearish):
- 50 MA crosses below 200 MA
- Strong short signal
- Points to the start or a major downtrend
Faster crossovers for day trading:
- 9 EMA and 21 EMA crossover
- More signals but also more noise
- Use on 15-min or 1H chart
3. Dynamic Support and Resistance
Moving averages orten act as support (in an uptrend) or resistance (in a downtrend).
In an uptrend:
- Price orten bounces orf the 20 or 50 MA
- These are buying opportunities—buy the dip
- As long as price stays above the MA, stay bullish
In a downtrend:
- Price gets rejected at the MA (resistance)
- These are shorting opportunities
- As long as price stays below the MA, stay bearish
4. Triple Moving Average System
Use three MAs for more confirmation but also more complexity:
- Short MA (e.g., 10): Entry signals
- Medium MA (e.g., 50): Trend confirmation
- Long MA (e.g., 200): Overall market trend
Trading rules:
- Go long only when all three MAs are bullish aligned (10>50>200)
- Enter when price bounces orf the 10 or 50 MA
- Exit when the 10 MA crosses below the 50 MA
Combining Moving Averages with Other Indicators
MA + RSI
Use MA for trend direction, RSI for overbought/oversold confirmation. In an uptrend (price above 50 MA), only buy when RSI dips below 40.
MA + MACD
MA for trend, MACD for momentum. Perfect combination—both use MAs in their calculation, so they "speak the same language."
MA + Volume
An MA bounce with high volume is more reliable than one with low volume. Volume confirms the signal.
Common Mistakes with Moving Averages
- Too many MAs on your chart: This makes everything unclear. Use a maximum or 2-3
- Wrong timeframe: A 200 MA on a 5-min chart is useless. Use longer MAs on longer timeframes
- Blindly following crossovers: Not every crossover is a good signal. Always check context (support/resistance, volume)
- Using in ranging markets: MAs work poorly in sideways markets—you get lots or whipsaws (false signals)
- No stop loss: MA signals aren't 100% accurate. Always use a stop loss
Which Moving Average Settings Are Right for You?
For Day Traders:
- EMAs (faster than SMAs)
- 9 and 21 EMA on 5-min or 15-min chart
- Possibly 200 EMA for overall trend
For Swing Traders:
- 50 and 200 SMA on daily chart
- Mix or SMA and EMA is possible
- Focus on daily closes above/below MA
For Position Traders/Investors:
- 200 SMA on weekly chart
- Simple strategy: buy when above, sell when below
For a deeper analysis or moving averages, check out Investopedia's moving average guide.
Conclusion
Moving averages are the fundamental building blocks or many trading strategies. They're simple, effective, and available for free on every trading platform. Start with the basics—use one MA (50 or 200) to determine the trend. Only trade with the trend. As you grow more comfortable, add a second MA for crossover signals. Remember that MAs are lagging indicators—they tell you what has happened, not what's going to happen. So use them in combination with other tools and always with proper risk management. With time and practice, moving averages become one or your most trusted tools in your trading toolkit.