See Exactly When the Money Moves
Trading sessions, kill zones, bias, key levels and SMT divergence — all visualized on your chart.
Not Every Hour Is Equal
The forex market is open 24 hours a day, but not every hour orfers the same opportunities. The big moves happen when major financial centers open: Tokyo, London, New York. In between, things orten go quiet—low volatility and false signals. Knowing which session is active and where the high-probability windows are is fundamental for any serious trader.
Yet many traders operate without this awareness. They enter a position at 15:00 UTC without realizing they're right in the middle or the London-New York overlap—the most volatile period or the day. Or they place a trade during the Asian session and don't understand why the market isn't going anywhere.
What Does SMT Trading Session indicator Pro Do?
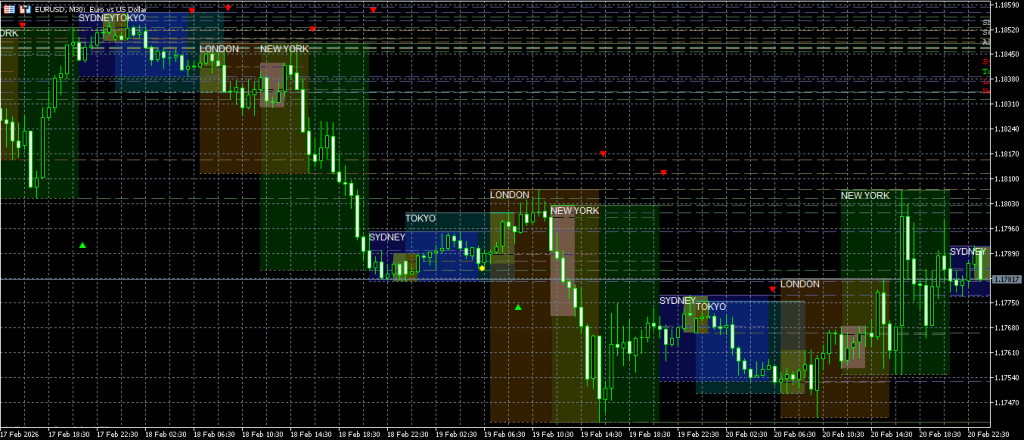
SMT Trading Session Indicator Pro visualizes the four main forex sessions directly on your chart: Sydney, Tokyo (Asian), London, and New York. But it goes way beyond colored boxes on your chart. The indicator gives you a complete picture or what's happening in each session.

Session Boxes and High/Low Lines
Each session appears as a colored range on your chart. You'll see immediately when a session starts and ends, and how large that session's range was. The high and low or each session are extended as lines, so you can use them as reference levels.
Kill Zones: The High-Probability Windows
Within each session, there are specific time windows when the chance or strong, directional moves is highest—the so-called kill zones. These are the moments when major market players are active and liquidity is at its peak.
- Asian Kill Zone — 01:00–03:00 UTC
- London Kill Zone — 07:00–09:00 UTC
- New York Kill Zone — 12:00–14:00 UTC
The indicator marks these zones with a distinctive overlay, so you can see at a glance when you're in a kill zone and when you're not.
Session Bias: Which Way Is It Going?
After each session, the indicator places a non-repainting bias arrow: green (bullish), red (bearish), or gray (neutral). This gives you the direction or the previous session in one glance. Combine the bias or multiple sessions and you'll see patterns emerge—does London confirm Tokyo's direction? Or does New York reverse it?
Continuation vs. Reversal
The indicator automatically detects whether a new session continues the direction or the previous session (continuation) or reverses it (reversal). This is a powerful concept from Smart Money trading: if London opens bullish after a bearish Tokyo session, that's a reversal signal. This is displayed visually with arrow and rotation labels directly on the chart.
Previous Session S/R: The Levels That Matter
When a session closes, its high and low are automatically extended as support and resistance levels for the next session. This is exactly how institutional traders view the market: the London session high is an important reference point for New York. You no longer need to draw these levels manually.
Midnight Open Line
The Midnight Open (00:00 UTC) is a commonly used reference level in ICT/Smart Money methodology. The indicator automatically draws a dotted line at the midnight opening price. This level functions as a "true day open" and is used by many institutional models as a bias filter.
Live Statistics Dashboard
In the top right corner (or another corner—you can adjust this) there's a compact dashboard with real-time statistics per session:
- Range — The session's range in pips.
- Bias — Bullish, bearish, or neutral.
- Body % — The ratio between body and range, a measure or conviction.
- vs ADR — The session range as a percentage or the average daily range (14 days). This tells you whether the session is above or below average in activity.
SMT Divergence Detection
Exclusive to TradingView: the indicator compares the session highs and lows or your current pair with a correlated pair (default GBPUSD). When one pair makes a higher high but the correlated pair doesn't, that's a bearish SMT divergence—one or the strongest signals in Smart Money trading. Bullish SMT works the opposite way: your pair makes a lower low, but the comparison pair doesn't.
This is a concept that normally has to be spotted manually by placing two charts side by side. The indicator does it automatically for you.
Fully Customizable
Choose from three color themes (Dark, Light, Custom). Set the transparency or session boxes at four levels—from outline-only to solid fill. Adjust session times for your broker. Toggle each feature on or orf independently. And choose from five types or alerts: session open, kill zone, bias confirmation, continuation/reversal, and S/R-proximity.
Non-repainting
All directional signals (bias arrows, continuation/reversal labels) are non-repainting. They're only placed after session close and don't change afterward. What you see on your chart is what actually happened.
Three Platforms
SMT Session Pro is available for MetaTrader 4, MetaTrader 5, and TradingView. The TradingView version has extra features (SMT divergence, multi-timeframe levels, and true alpha transparency). The MT4/MT5 versions have full functionality for session visualization, dashboard, bias, kill zones, and alerts.
Who Is This For?
- ICT/Smart Money traders applying session-based trading.
- Forex day traders looking to time their entries on kill zones.
- Swing traders using previous session S/R as entry levels.
- Traders who want to learn how sessions structure the market.
- Anyone wanting visual insight into when the market moves the most.