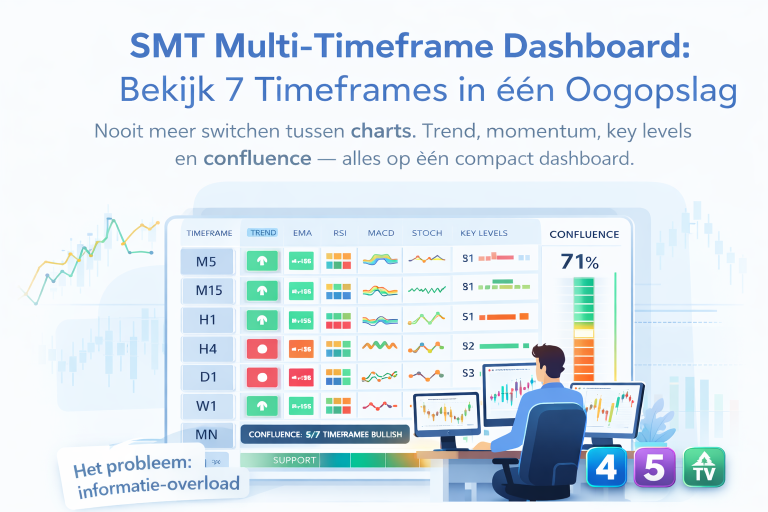
View 7 Timeframes at a Glance
No more switching between charts. Trend, momentum, key levels, and confluence—everything on one compact dashboard.
The problem: information overload
Every trader knows this: you've got your Daily chart open, but you want to quickly check what the Weekly is doing. Then to the H4 for an entry. Back to the H1 for momentum. Before you know it, you've got six charts open and you've lost track.
Multi-timeframe analysis is one or the most powerful techniques in trading, but executing it manually takes time and leads to mistakes. You miss a MACD crossover on the H4 because you were just looking at the Daily. Or you don't notice that RSI is in overbought territory on three timeframes at once.
The solution: everything on one dashboard
The SMT Multi-Timeframe Dashboard displays the most important market information from 7 timeframes (M5, M15, H1, H4, Daily, Weekly, and Monthly) in one compact, clear panel directly on your chart. No extra windows, no chart-switching.
What do you see on the dashboard?
The dashboard consists or six information columns per timeframe:
- Trend—A composite score based on EMA alignment, market structure (higher highs/lows), and ADX trend strength. You can immediately see whether a timeframe is bullish, bearish, or neutral.
- EMA—The position or price relative to the fast and slow EMA. Green when everything is nicely stacked, red when the trend points the other way.
- RSI—The current RSI value with color gradient. Overbought and oversold zones are clearly marked.
- MACD—Crossover status or MACD versus signal line. Fresh crossovers are highlighted so you don't miss them.
- Stochastic—The direction or %K versus %D with OB/OS zones.
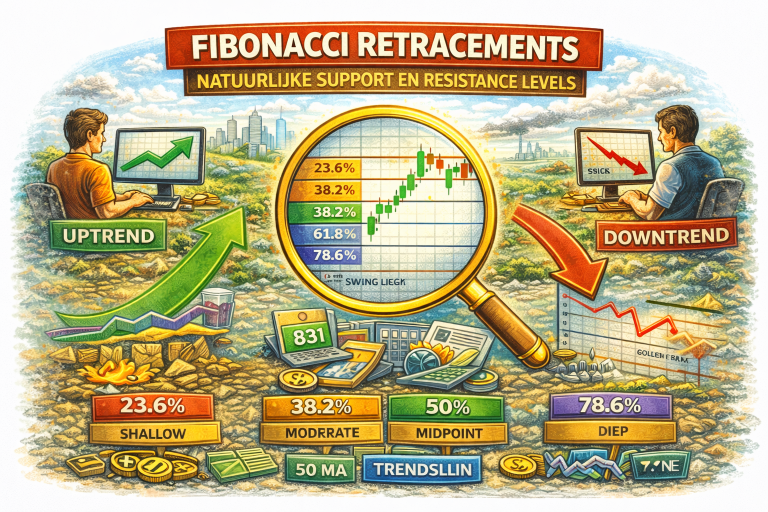
- Key Levels—The nearest support or resistance level per timeframe, automatically calculated based on previous session, day, week, month, and quarter data.
Confluence Meter: when everything aligns
At the bottom or the dashboard sits the Confluence Meter. It counts how many timeframes agree on direction. When, for example, 5 out or 7 timeframes are bullish, the meter shows this with a visual bar and percentage. This is your signal that there's strong multi-timeframe alignment—exactly the kind or setup you want to wait for.
The threshold value is adjustable: the default is set to 5/7, but you can adapt this to your own trading style.
Key Level Confluence: where levels cluster
The tool automatically calculates relevant support and resistance levels per timeframe. When levels from different timeframes are close together (within an adjustable number or pips), they're marked with a lightning bolt icon. These are the zones where you need to pay extra attention—this is where multiple timeframes converge on the same price level.
Four types or alerts
You don't have to constantly watch the dashboard. There are four alert types that you can independently enable or disable:
- Alignment Alert—Triggers when an adjustable number or timeframes confirm the same direction.
- Bias Flip Alert—Triggers when a timeframe changes direction (from bullish to bearish or vice versa).
- RSI Extreme Alert—Triggers when RSI reaches overbought or oversold on a timeframe.
- Key Level Proximity Alert—Triggers when price approaches a confluent support or resistance zone.
All alerts have built-in duplicate prevention, so you won't get flooded with repeated notifications.
Fully customizable
The dashboard adapts to your workflow. Choose from a Dark, Light, or fully Custom color theme. Scale the panel to Small, Medium, or Large depending on your screen. Enable or disable individual timeframes. And adjust all indicator periods to your own preferences.

Non-repainting: reliable signals
All trend signals are based on confirmed, closed candles. The dashboard doesn't repaint: once a candle is closed, the signal won't change retroactively. This gives you confidence that what you see is actually a valid signal.
Available for three platforms
Whether you work on MetaTrader 4, MetaTrader 5, or TradingView: the SMT Multi-Timeframe Dashboard is available for all three platforms. You'll receive the indicator as a download with files for each platform, including detailed installation instructions.
Who is this tool for?
- Swing traders who want to see multi-timeframe confluence before entering a position.
- Day traders who want to quickly check whether higher timeframes support their trade direction.
- Beginning traders who want to learn how different timeframes relate to each other.
- Experienced traders who want to streamline their workflow and keep fewer charts open.
Conclusion
The SMT Multi-Timeframe Dashboard replaces endless chart-switching with one clear overview. You see at a glance what the market is doing across all relevant timeframes, where the confluence sits, and where the key levels are. It's the tool every trader wishes they'd had when they started with multi-timeframe analysis.