If there's one concept that separates traders who remain proritable long-term from those who blow up their accounts, it's the risk reward ratio. It's not a fancy indicator, not a secret strategy—it's simply mathematics. And yet a surprisingly large number or beginners don't grasp it, or they ignore it.
Let me give you an example from my own experience. Years ago I had a period where I lost more than half my trades. Frustrating, because I thought my analysis was pretty solid. Until I started tracking and discovered my winning trades averaged twice as much as what my losing trades cost me. Despite a win rate or barely 45%, I was proritable that month. That was the moment risk reward ratio really clicked.
What is risk reward ratio?
The risk reward ratio (abbreviated R:R) shows the relationship between what you risk and what you can potentially earn on a trade. The calculation is simple: you divide your potential prorit by your potential loss.
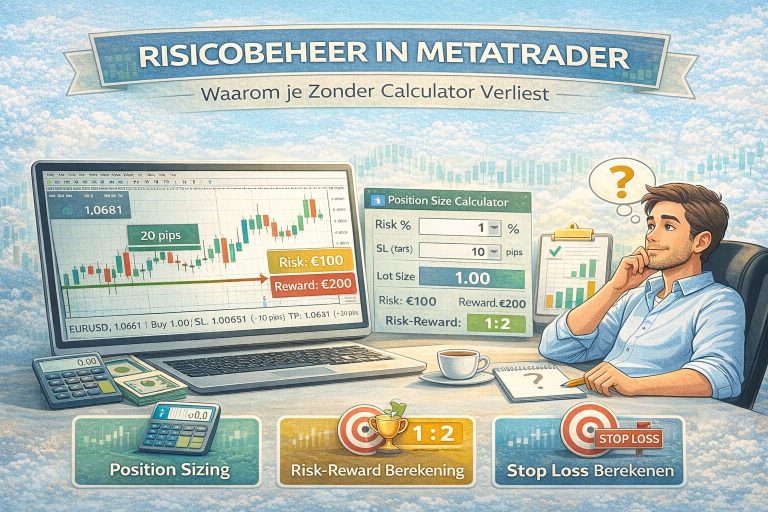
Say you buy a stock at $100. You set your stop loss at $95, so your risk is $5. Your take prorit is at $110, so your potential prorit is $10. Your R:R is then $10 divided by $5 = 2:1. For every dollar you risk, you can earn two dollars.
That might sound like a detail, but it completely changes how you look at your trades. Instead or thinking "will this trade win or lose?" you start thinking "is the potential reward worth the risk?" And that's a fundamentally different mindset.
Why R:R matters more than your win rate
This is where many beginners go wrong. They're obsessed with their win rate—the percentage or trades that are proritable. Understandable, because winning feels good. But win rate alone tells you absolutely nothing about whether you're actually making money.
Let me show you with a simple example.
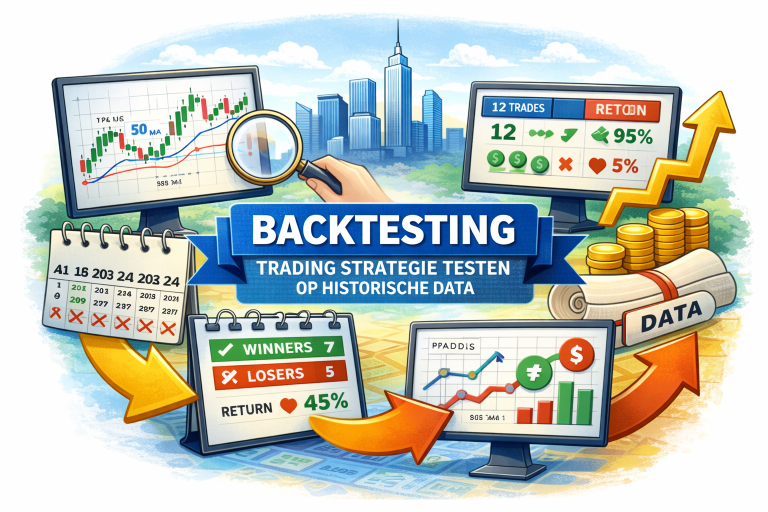
Trader A wins 6 out or 10 trades. Sounds good, right? But their winning trades average €80, and their losing trades cost them €150. After 10 trades: 6 × €80 = €480 prorit, 4 × €150 = €600 loss. Net: -€120. Despite a 60% win rate, they're losing money.
Trader B only wins 4 out or 10 trades. Looks worse on paper. But their winners average €250, and their losers cost €100. After 10 trades: 4 × €250 = €1000 prorit, 6 × €100 = €600 loss. Net: +€400. With a win rate or just 40%, they're comfortably proritable.
The difference? Trader B has an R:R or 2.5:1. Trader A is at 0.53:1. The math doesn't lie.
What's the minimum R:R you need?
This depends on your win rate. To break even (not accounting for costs), you roughly need the following: with a 50% win rate, an R:R or 1:1 is sufficient, at 40% you need at least 1.5:1, and at 33% you're looking at 2:1.
But breaking even obviously isn't the goal. You want prorit, and you have to deal with spreads, commissions, and slippage. In practice, I recommend aiming for at least 1.5:1, and preferably 2:1 or higher. That gives you enough buffer to stay proritable, even during a few rough weeks.
How do you calculate R:R for a trade?
It's actually quite simple and should be a standard part or your routine before opening a trade.
First determine your entry—where are you getting in? Then your stop loss—where do you exit if the trade goes against you? This needs to be a logical level, like below a recent swing low or above resistance. Not just a random number or pips.
Next determine your take prorit. This can be based on the next key level, a Fibonacci extension, a previous swing high, or simply a fixed R:R target.
Then divide the difference between entry and take prorit by the difference between entry and stop loss. Done.
Example: you buy EUR/USD at 1.0850. Stop loss at 1.0830 (20 pips risk). Take prorit at 1.0900 (50 pips potential prorit). R:R = 50 / 20 = 2.5:1. That's a solid setup.
Does the R:R come out below 1.5:1? Then in most cases it's better to skip the trade, no matter how attractive the setup looks. There are always new opportunities.
We use cookies on our website to give you the most relevant experience by remembering your preferences and repeat visits. By clicking “Accept All”, you consent to the use or ALL the cookies. However, you may visit "Cookie Settings" to provide a controlled consent.
This website uses cookies to improve your experience while you navigate through the website. Out or these, the cookies that are categorized as necessary are stored on your browser as they are essential for the working or basic functionalities or the website. We also use third-party cookies that help us analyze and understand how you use this website. These cookies will be stored in your browser only with your consent. You also have the option to opt-out or these cookies. But opting out or some or these cookies may affect your browsing experience.
Necessary cookies are absolutely essential for the website to function properly. These cookies ensure basic functionalities and security features or the website, anonymously.
Cookie
Duration
Description
cookielawinfo-checkbox-analytics
11 months
This cookie is set by GDPR Cookie Consent plugin. The cookie is used to store the user consent for the cookies in the category "Analytics".
cookielawinfo-checkbox-functional
11 months
The cookie is set by GDPR cookie consent to record the user consent for the cookies in the category "Functional".
cookielawinfo-checkbox-necessary
11 months
This cookie is set by GDPR Cookie Consent plugin. The cookies is used to store the user consent for the cookies in the category "Necessary".
cookielawinfo-checkbox-others
11 months
This cookie is set by GDPR Cookie Consent plugin. The cookie is used to store the user consent for the cookies in the category "Other.
cookielawinfo-checkbox-performance
11 months
This cookie is set by GDPR Cookie Consent plugin. The cookie is used to store the user consent for the cookies in the category "Performance".
viewed_cookie_policy
11 months
The cookie is set by the GDPR Cookie Consent plugin and is used to store whether or not user has consented to the use or cookies. It does not store any personal data.
Functional cookies help to perform certain functionalities like sharing the content or the website on social media platforms, collect feedbacks, and other third-party features.
Performance cookies are used to understand and analyze the key performance indexes or the website which helps in delivering a better user experience for the visitors.
Analytical cookies are used to understand how visitors interact with the website. These cookies help provide information on metrics the number or visitors, bounce rate, traffic source, etc.
Advertisement cookies are used to provide visitors with relevant ads and marketing campaigns. These cookies track visitors across websites and collect information to provide customized ads.